The aim of performance management is to see how well something or someone is doing (usually in relation to a plan or target) e.g. last year’s results, a budget, other businesses. It can be divided into; financial and non-financial performance indicators.
Steps in Measuring Performance
- Set strategic business objectives i.e. things that businesses must do to be successful.
- Set critical success factors i.e. things that a business must be good at to achieve its strategic business objectives (the right price, customer satisfaction, product quality).
- Critical success factors are translated into key performance indicators (KPI’s) i.e. things that we can measure and set targets on.
Successful Performance Measures
For performance measures to be successful they must;
- Be consistent with the strategy and objectives of the organisation.
- Be a feedback and a review system.
- Be financial and non-financial.
- Be measured in relation to something for comparative purposes.
- Be short-term and long-term – dependent on the objective.
- Be monitored regularly – feedback loop.
Financial Performance Indicators
Profit – gross or net profit.
![]()
![]()
Revenue – actual percentage increase, revenue as a percentage of assets.
![]()
ROI shows the level of profit in relation to the capital invested.
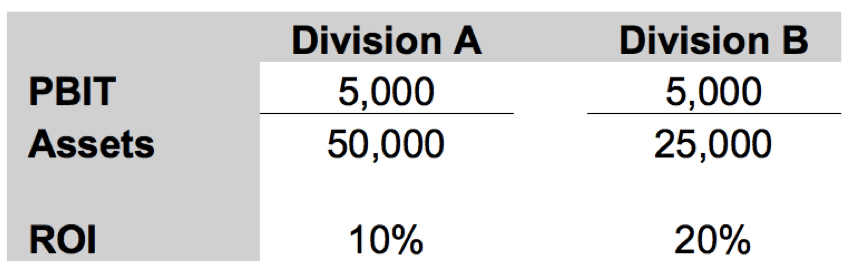 Organisations should look for changes in the ROI year on year for any abnormalities and it should be compared with other companies or divisions.
Advantages
- Allows comparison of different sized divisions.
- Easy to understand.
Disadvantages
- Can lead to short-termism.
- Can be worked out in different ways – so comparisons may be inaccurate.
- Can put managers off investing.
- Can be manipulated by divisional managers.
Costs – actual percentage increase or decrease, total change, each type of cost as a percentage of sales.
Non-financial Performance Indicators
In more recent years, non-financial performance indicators have become increasingly important. Non-financial performance measures can provide a wider measure of performance than financial measures and therefore things like customer satisfaction, product quality and effectiveness can be examined. Similarly, looking at wider measures of performance can stop managers concentrating on certain key figures e.g. sales or profits, and ignoring other key indicators. Non-financial measures of performance can be said to be more long term in that it is easier to manipulate financial performance measures in the short-term to show favourable results, but it is more difficult to manipulate non-financial measures.
Performance Measurement in Service Industries
As these industries do not provide a physical product, it may seem more difficult to measure their performance. Again, a range of measure should be used;
- competitive performance: sales growth, market share
- financial performance: revenue, profit, costs
- quality of service: customer satisfaction
- flexibility: speed of delivery, response to customers
- resource utilisation: measured by productivity
- innovation: research and development, new services provided
Performance Measurement in Non-profit Making Organisations
Non-profit making organisations include charities, public sector organisations e.g. leisure centres, government etc. As these organisations don’t make profits, they cannot use certain performance measures e.g. GP margin, NP margin. Therefore, performance measures for these organisations should cover;
- Economy – spending money wisely.
- Efficiency – getting as much from the resource as possible.
- Effectiveness – achieving objectives.
Divisional Performance Measurement
Organisations can be split into functions e.g. sales, production, admin etc., or they can be split into divisions where each division is like a small company, and each divisional manager is responsible for all operations within their divisions. In such a structure, decision-making is decentralised and divisional managers have more freedom to decide on how to run their own business. Divisions or departments are usually monitored as responsibility centres and their performance is compared against targets or other departments.
Cost-Volume Profit Analysis
Cost-volume profit analysis is based on cost (and revenue) behaviour. It examines the relationship between cost, volume and profit and can be used to answer questions like;
- How many units must be sold to break even?
- How many units need to be sold to make a given profit figure?
- What profit/loss will be incurred if only a given number of units can be sold?
Break-even: total sales revenue = total costs
The breakeven point is the point at which sales (in units or pounds) gives a profit or loss equal to zero.
![]()
![]()
Total costs: total variable costs + total fixed costs
Contribution* per unit: sales revenue per unit – variable cost per unit
*contributes to covering fixed costs, once fixed costs are covered, any surplus contributes to profit.
Margin of Safety
The amount by which sales can fall before a loss is made: planned quantity/sales – breakeven quantity/sales
The margin of safety may also be expressed as a percentage of sales.
![]()
The higher the percentage, the less risk there is as sales can fall more before reaching breakeven.
Profit/Loss
Profit/Loss = (unit contribution x volume) – fixed costs
- if the figure is zero, it is breakeven
- if the figure is positive, it is a profit
- if the figure is negative, it is a loss
For presentation purposes, cost-volume profit analysis can be constructed graphically, however, graphs lack the precision of calculations, but given that we are dealing with an uncertain future, the calculation of precise figures could give a misleading impression of accuracy.


The maximum loss is equal to the fixed costs when sales are equal to zero.
Cost-volume profit analysis can allow for changes in costs and prices e.g. stepping the fixed cost line and creating new lines with different slopes to cope with changes in variable costs and the selling price. However, it is helpful to establish a ‘relevant range’ – the range of output within which a set of linear relationships hold, and reconstruct the analysis when one moves out of the range e.g. if the firm decides to reduce the unit selling price in order to increase sales volume, although the change can be incorporated on a breakeven chart, it is probably easier, and certainly clearer, to draw a new one. Cost-volume profit analysis relates profit to volume, it does not relate profit to capital employed. The analysis may show increasing profit, but if this has been achieved by increasing the firms fixed asset base more than proportionally, the return on capital employed may have gone down.
–
Featured image courtesy of https://www.executiveboard.com/blogs/files/2013/05/Raeves.jpg
